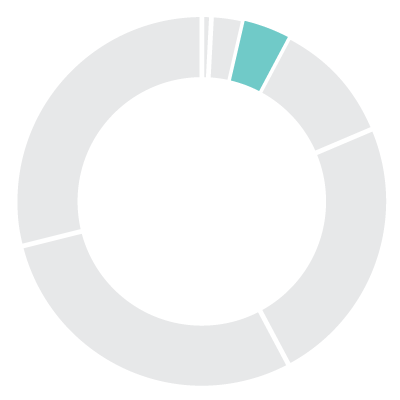
Sources of Current Funds
for the fiscal year ended June 30, 2017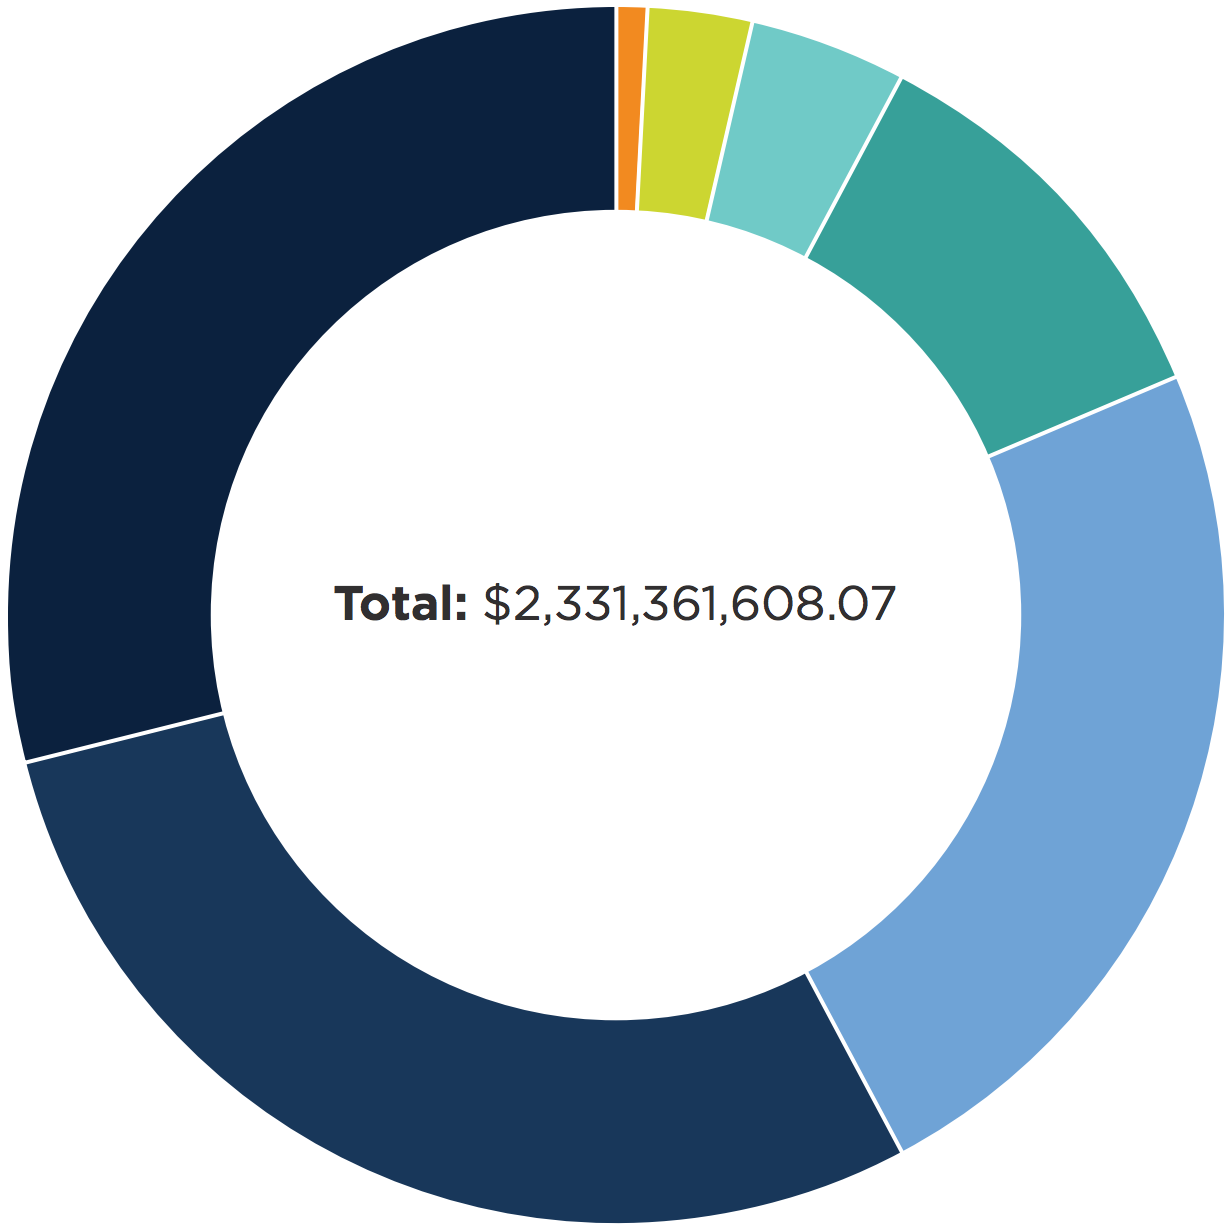
Federal and Local Appropriations
1.2% | $19,746,715.78Appropriations received in support of the University’s land grant missions, used primarily by the Agricultural Experiment Station and Tennessee Extension.
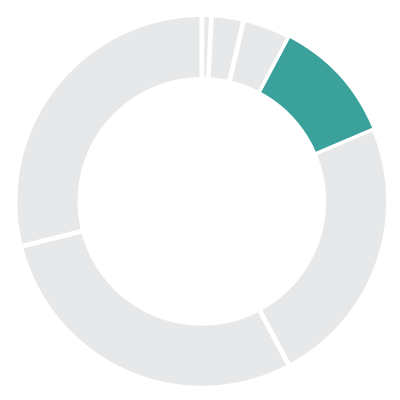
Independent Operations
2.8% | $66,196,961.92Revenues collected from UT Medical Center in Knoxville and the UT Foundation for leased employees.
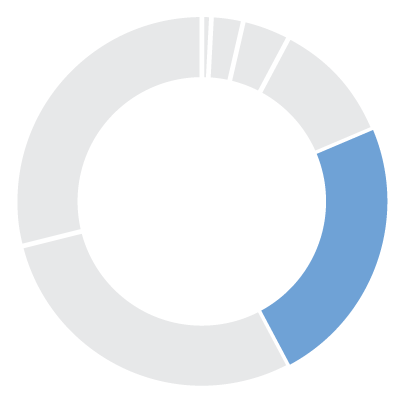
Other
4.1% | $96,448,328.90Revenues generated from sources not included in other classifications, such as sales and services by University departments and investment income.
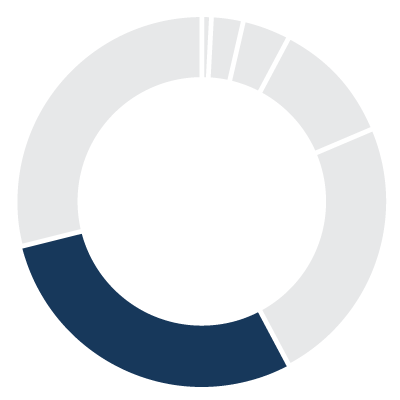
Auxiliary Expenses
10.6% | $246,478,811.01Revenues from operations of auxiliary activities such as housing, dining halls, bookstores, parking and UT Knoxville athletics.
State Approppriations
23.5% | $547,516,593.00Legislative appropriations from the Tennessee General Assembly for current operations of the University.
Gifts, Grants, and Contracts
28.9% | $673,914,183.38Revenues from federal and non-federal granting entities and gifts restricted for specific purposes, primarily for sponsored research and training activities.
Tuition and Fees
29.2% | $681,060,014.08Revenues collected from students; includes resident enrollment fees, program and service fees, extension enrollment fees and other fees.
Total: $2,331,361,608.07
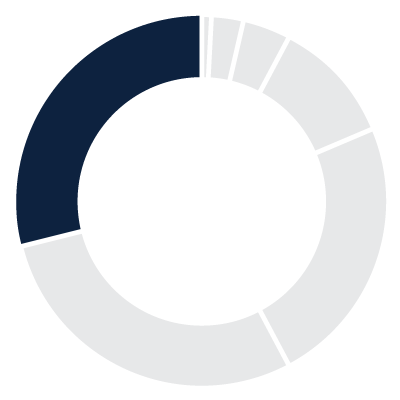
Uses of Current Funds
for the fiscal year ended June 30, 2017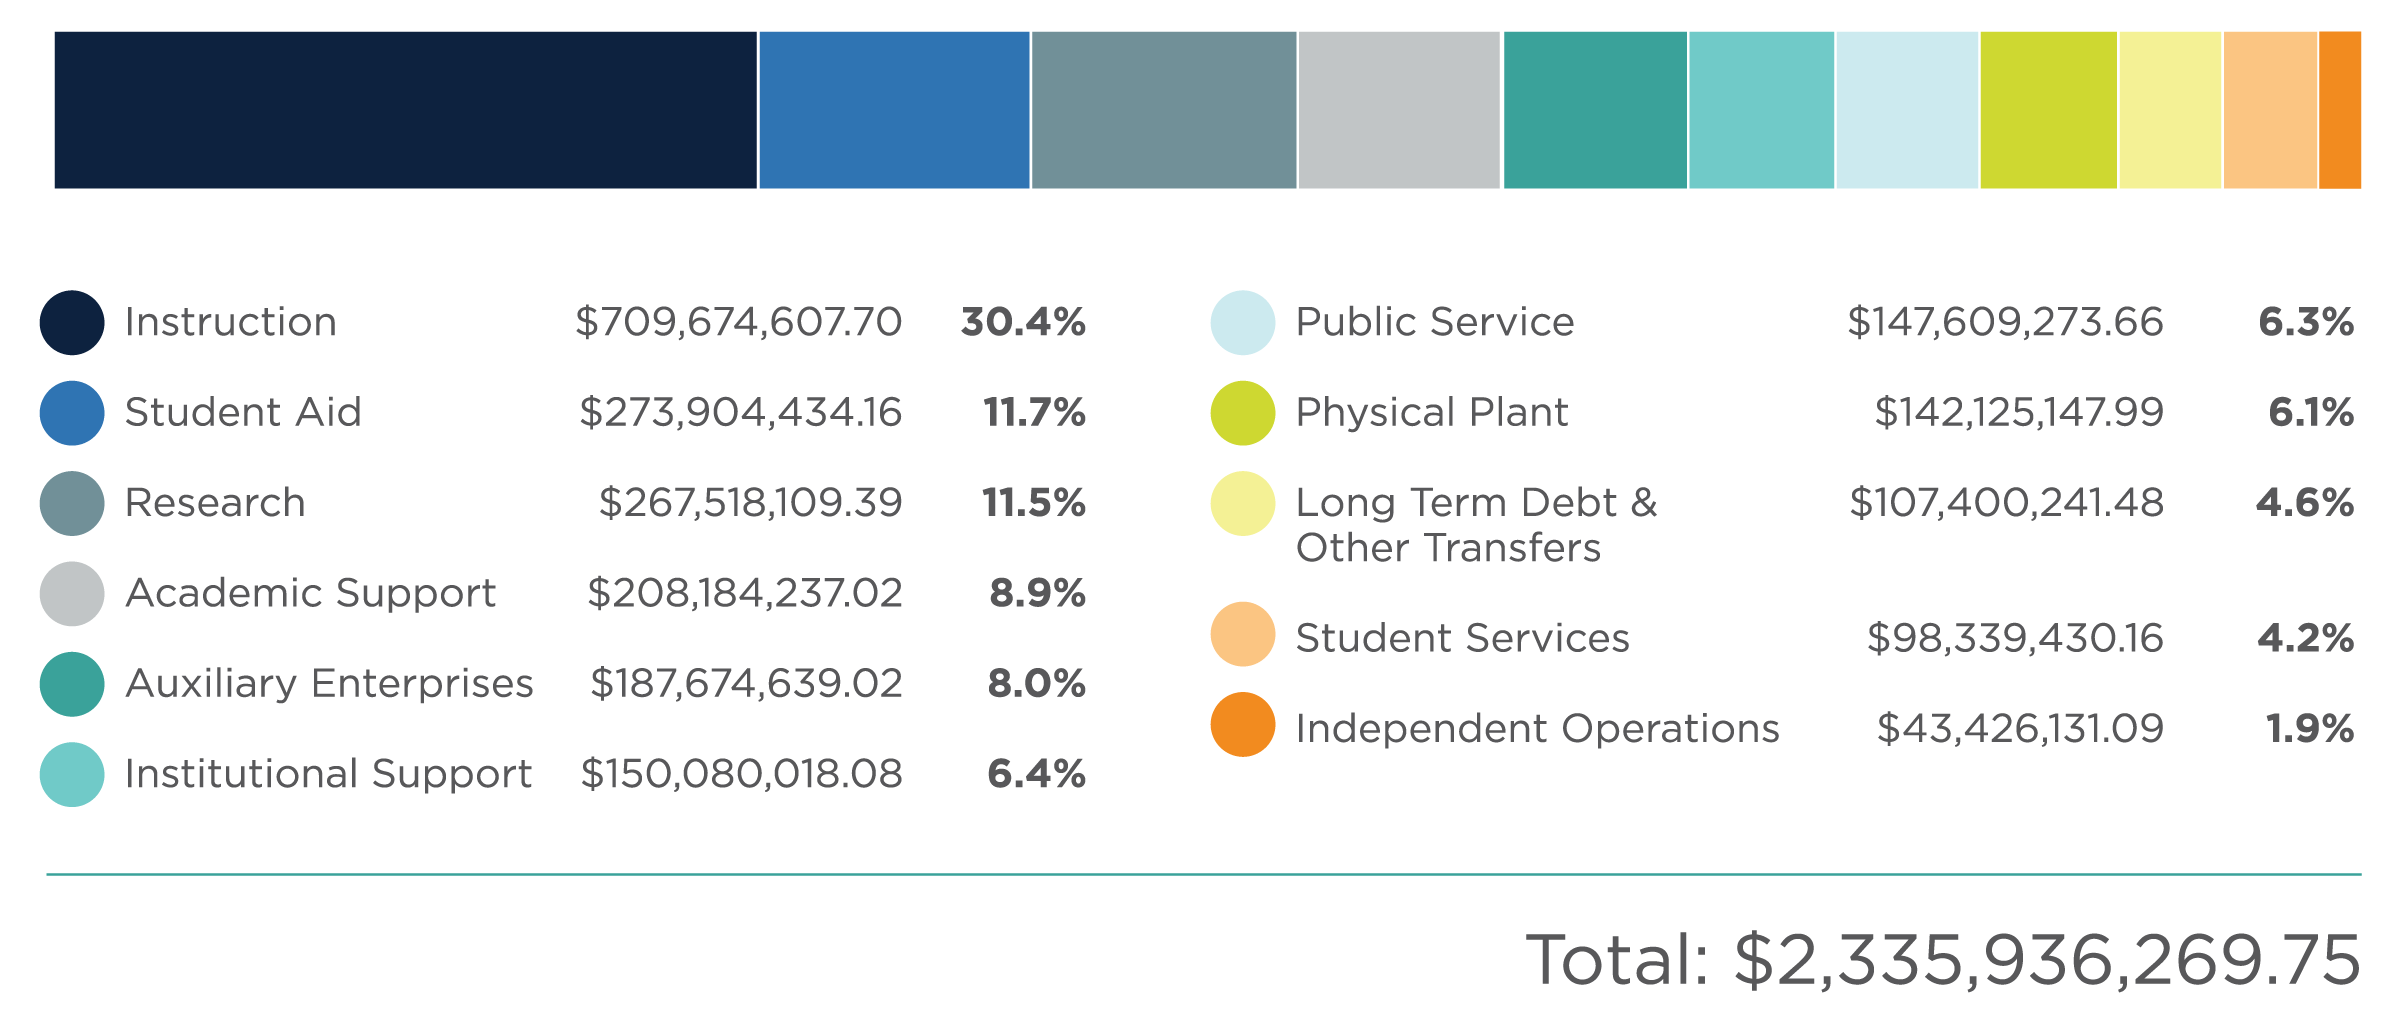
Instruction
$709,674,607.7030.4%
Includes all expenditures, including faculty and staff salaries incurred in connection with instruction programs for credit and non-credit courses.
Student Aid
$273,904,434.1611.7%
Scholarships and fellowships awarded to students.
Research
$267,518,109.3911.5%
Direct expenditures for sponsored research activities funded from federal, state, local and private sources.
Academic Support
$208,184,237.028.9%
Expenditures for libraries, computing support and academic administration.
Auxiliary Enterprises
$187,674,639.028.0%
Activities that furnish goods and services to students, faculty and staff. Includes mandatory transfers for debt service.
Institutional Support
$150,080,018.086.4%
Expenditures for executive management, financial operations, personnel services, security, public relations, development activities and alumni relations.
Public Service
$147,609,273.666.3%
Expenditures for non-instructional programs beneficial to individuals and groups external to the University.
Physical Plant
$142,125,147.996.1%
Expenditures for the operation and maintenance of physical plant including utilities and service related to grounds and facilities.
Long-Term Debt & Other Transfers
$107,400,241.484.6%
Mandatory transfers for debt service and other transfers.
Student Services
$98,339,430.164.2%
Expenditures for student services including admissions, registrar, student activities, counseling, career guidance, student aid administration and health services.
Independent Operations
$43,426,131.091.9%
Expenditures for leased employees for UT Medical Center in Knoxville and the UT Foundation.
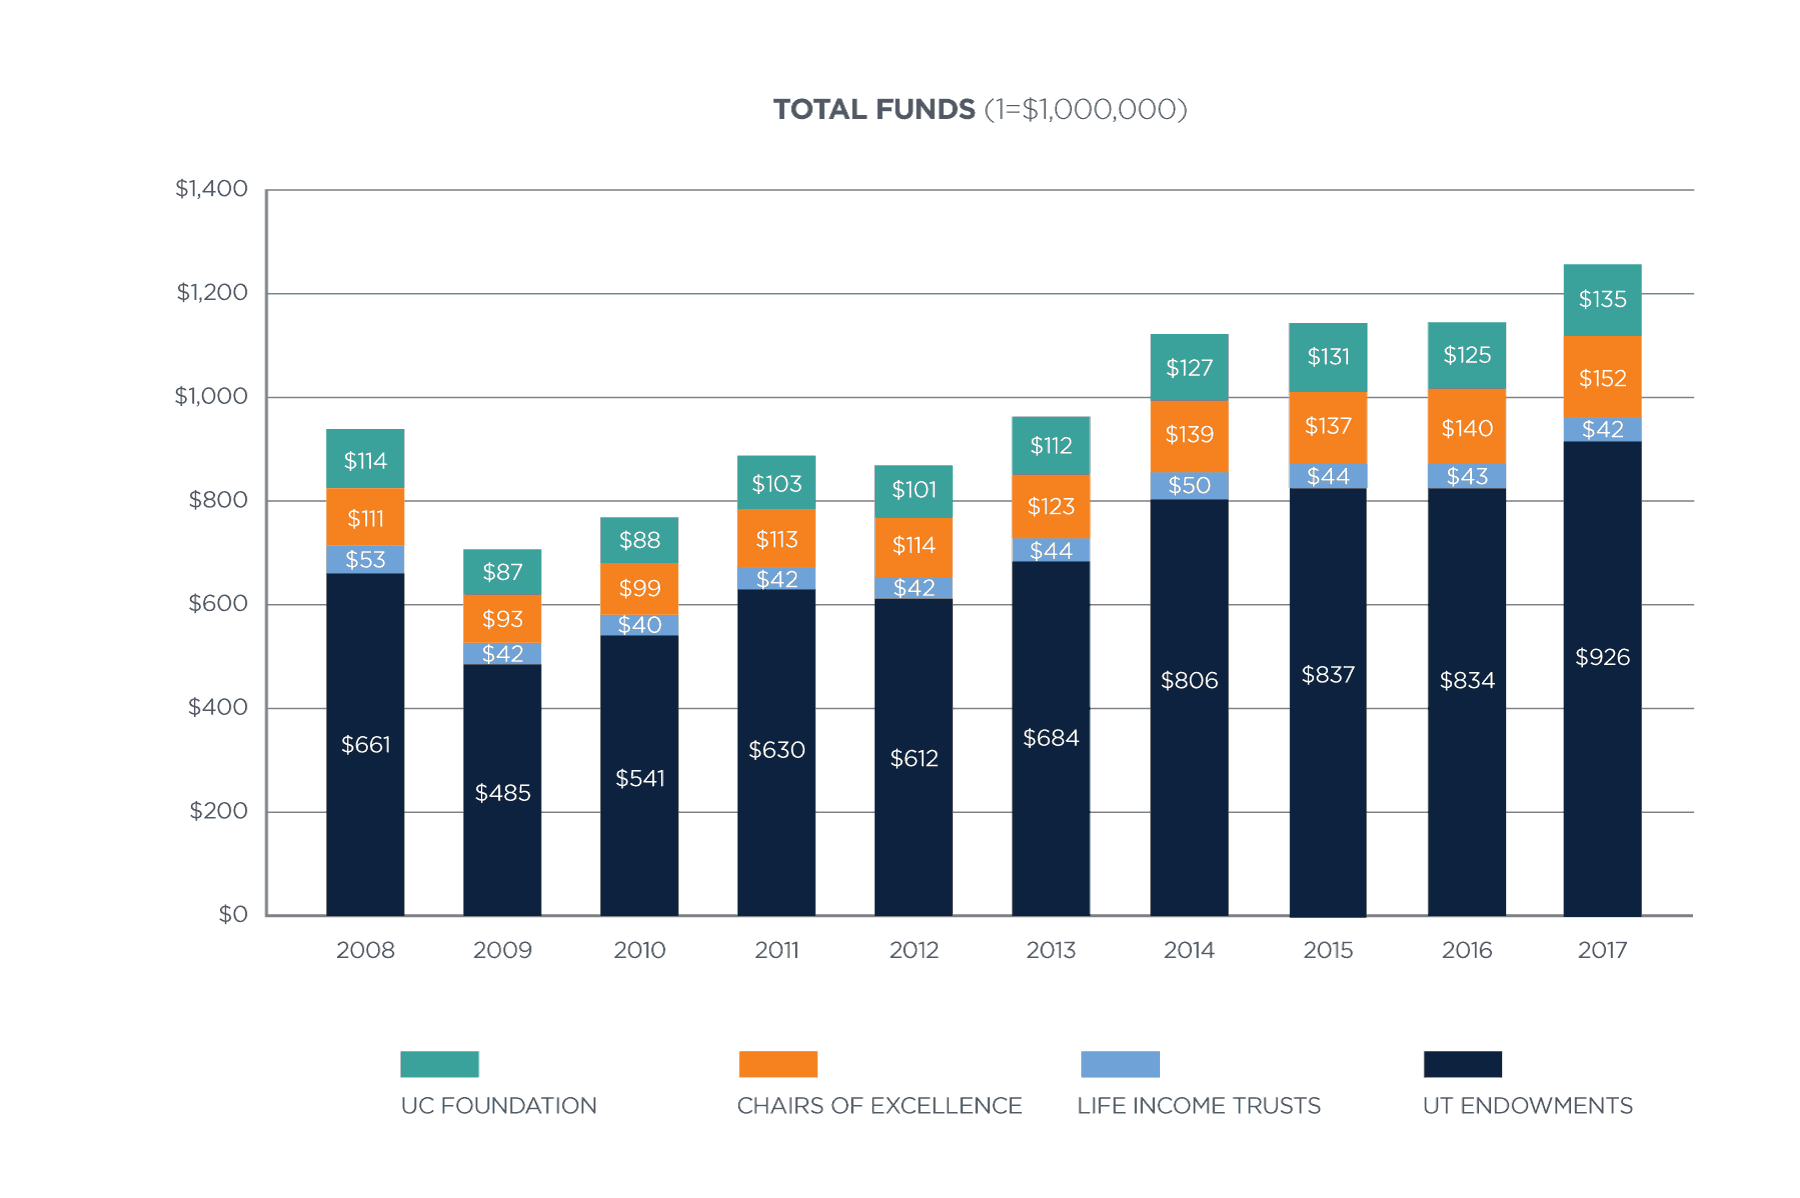
Investments Benefiting the University
For fiscal period ending on June 30, 2017 total assets invested for the benefit of University of Tennessee were $1.3 billion, an increase of $114 million over the prior year. This growth was driven by improving economic trends, corporate earnings, and the quieting reassurance of central bankers. Global stocks provided the greatest lift, along with private equity.
Beyond those two asset classes, however, high-yield debt was the only other broad category to post double-digit returns for the period. In contrast, most commodities, global investment-grade bonds, and public real estate were flat or negative for the twelve months. Inflation expectations remained modest, and investors began to anticipate a rising interest-rate cycle driven by the Federal Reserve. These combined factors left energy to trade on bearish supply and demand fundamentals, while real estate and bonds fell victim to a higher expected discount rate. In short, equity and speculative debt drove returns, as there was little else to move the markets higher over the year.
The University’s capital base includes five separate investment vehicles. At June 30, endowments accounted for $926 million, with $911 million in the Consolidated Investment Pool and $15 million in separate endowments. Chairs of Excellence were $152 million, and the University of Chattanooga Foundation was $135 million. Finally, Life Income Trusts stood at $42 million. The accompanying chart displays these categories at each fiscal year-end for the past ten years.
The Consolidated Investment Pool (the Pool) is the largest component of invested funds and was established in 1954 to allow for the diversification and efficient investment of any endowment, regardless of size. With the dual mandate of generating long-term total returns above the spending rate while simultaneously managing downside risk, it maintains a globally diversified portfolio. For the fiscal period ending June 30, one, five, and ten-year total returns were +9.9%, +7.4%, and +3.1%, respectively. The Pool distributed $39 million in fiscal 2017, an increase of approximately $3 million from the prior year.
Other distributions included those made by The Tennessee Chairs of Excellence and the University of Chattanooga Foundation of $4 million and $8 million, respectively. Both of these categories are managed outside the Pool. The Chairs of Excellence are administered by the treasurer of the state of Tennessee for the benefit of all UT campuses. The University of Chattanooga Foundation is managed by its foundation board and supports programs at UT Chattanooga only.