Financials
Sources of current funds for the fiscal year ended June 30, 2016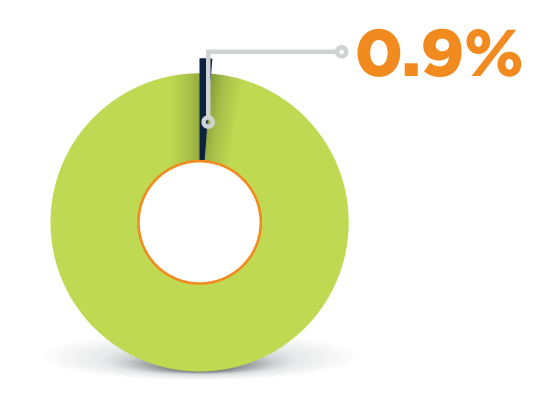
Federal and Local Appropriations
$20,569,514.71Appropriations received in support of the University’s landgrant missions, used primarily by the Agricultural Experiment Station and Tennessee Extension.
Independent Operations
$68,909,954.42Revenues collected from UT Medical Center in Knoxville and the UT Foundation for leased employees.
Other
$142,298,011.97Revenues generated from sources not included in other classifications, such as sales and services by University departments and investment income.
Auxiliary Expenses
$243,291,225.13Revenues from operations of auxiliary activities such as housing, dining halls, bookstores, parking and UT Knoxville athletics.
State Approppriations
$518,655,492.94Legislative appropriations from the Tennessee General Assembly for current operations of the University.
Gifts, Grants, and Contracts
$625,296,781.94Revenues from federal and non-federal granting entities and gifts restricted for specific purposes, primarily for sponsored research and training activities.
Tuition and Fees
$655,160,210.43Revenues collected from students; includes resident enrollment fees, program and service fees, extension enrollment fees and other fees.
Total: $2,274,181,191.54
Financials
Uses of current funds for the fiscal year ended June 30, 2016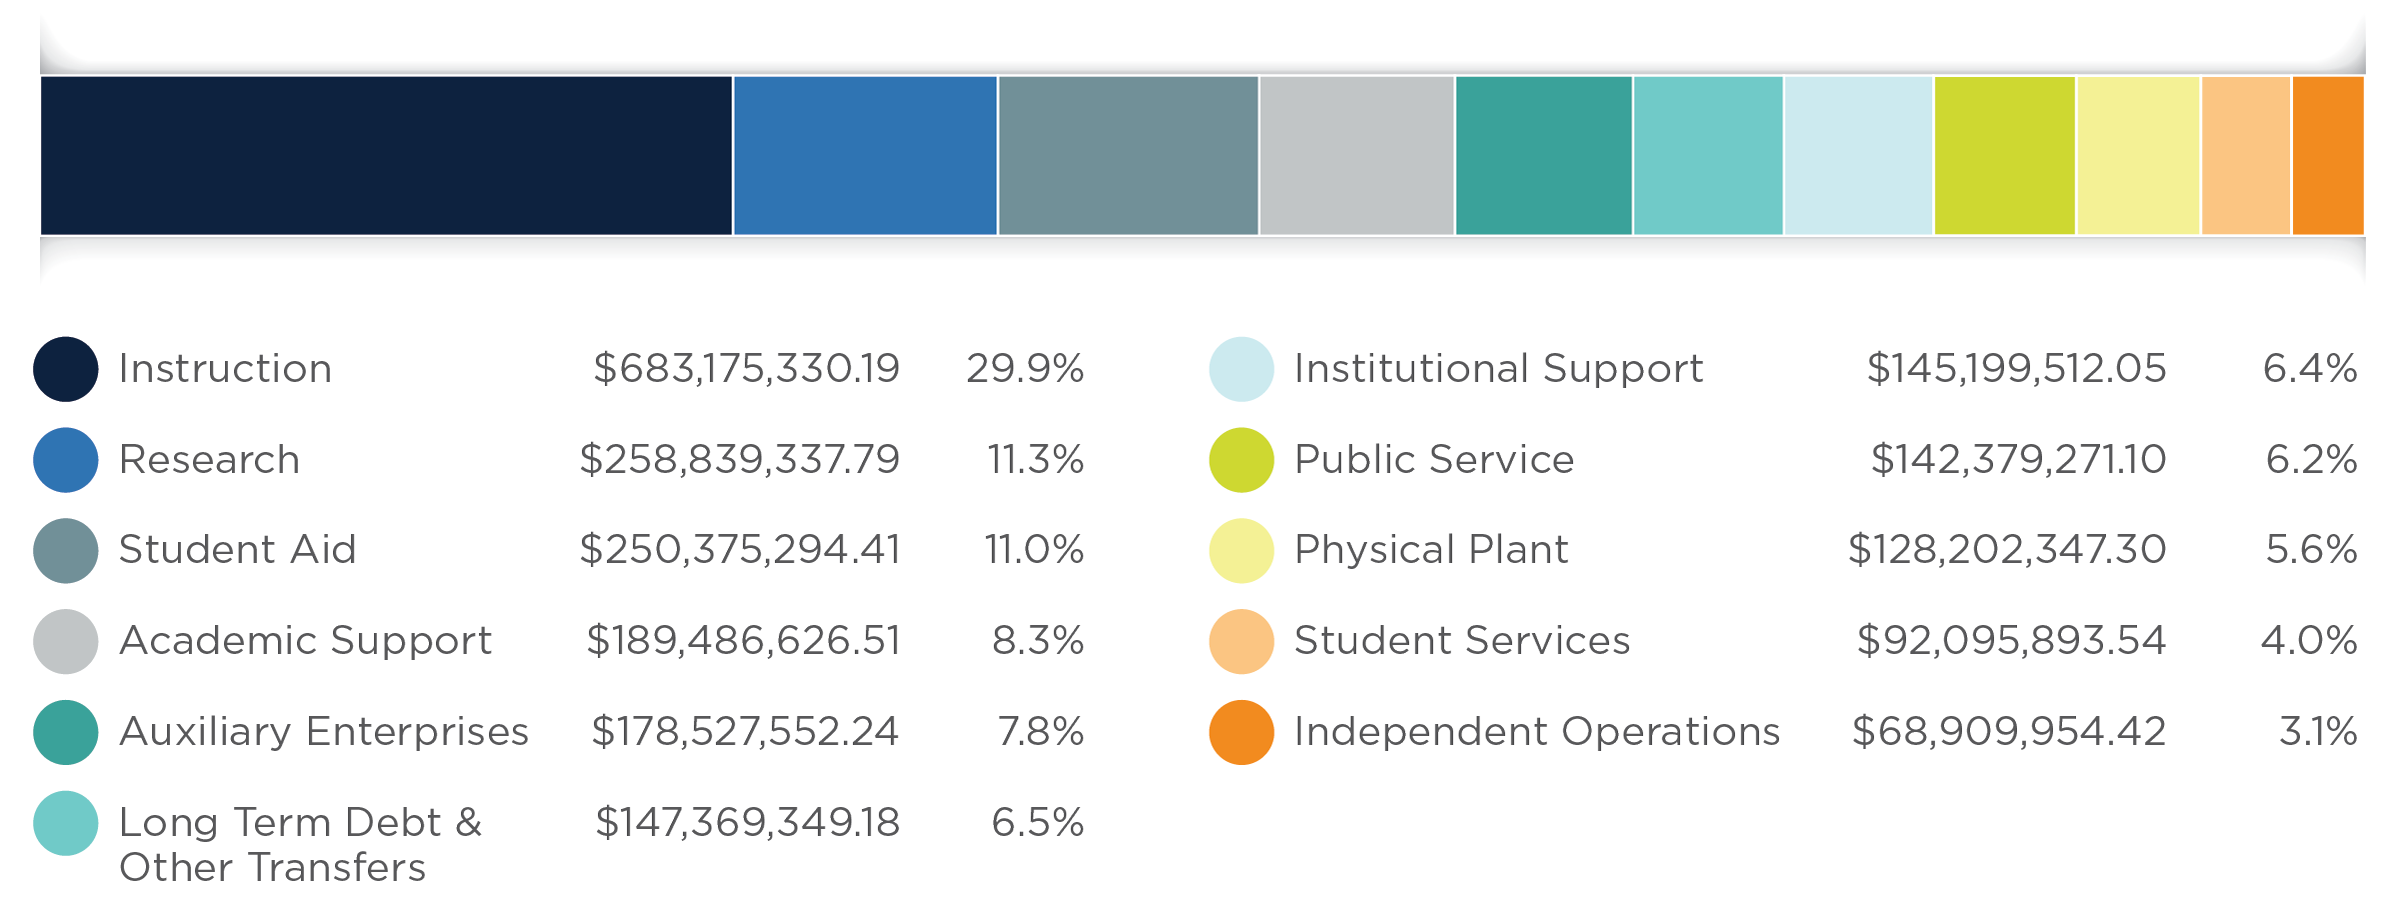
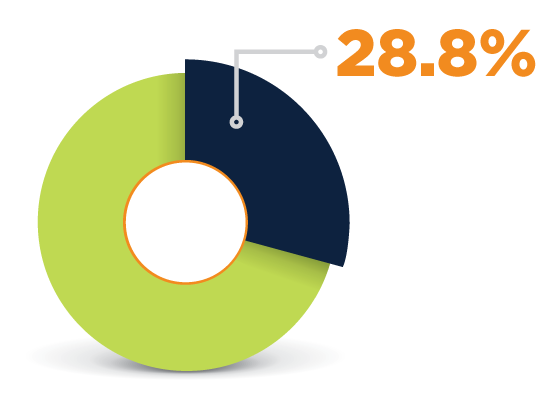
Instruction
$683,175,330.1929.9%
Includes all expenditures, including faculty and staff salaries incurred in connection with instruction programs for credit and non-credit courses.
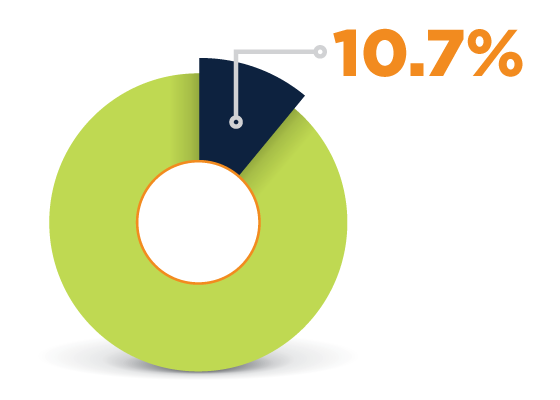
Research
$258,839,337.7911.3%
Direct expenditures for sponsored research activities funded from federal, state, local and private sources.
Student Aid
$250,375,294.4111.0%
Scholarships and fellowships awarded to students.
Academic Support
$189,486,626.518.3%
Expenditures for libraries, computing support and academic administration.
Auxiliary Enterprises
$178,527,552.247.8%
Activities that furnish goods and services to students, faculty and staff. Includes mandatory transfers for debt service.
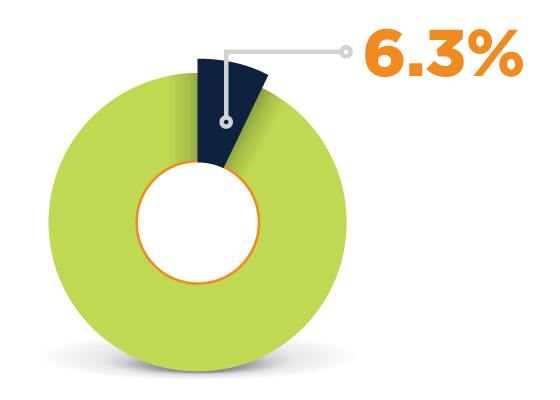
Long-Term Debt & Other Transfers
$147,369,349.186.5%
Mandatory transfers for debt service and other transfers.
Institutional Support
$145,199,512.056.4%
Expenditures for executive management, financial operations, personnel services, security, public relations, development activities and alumni relations.
Public Service
$142,379,271.106.2%
Expenditures for non-instructional programs beneficial to individuals and groups external to the University.
Physical Plant
$128,202,347.305.6%
Expenditures for the operation and maintenance of physical plant including utilities and service related to grounds and facilities.
Student Services
$92,095,893.544.0%
Expenditures for student services including admissions, registrar, student activities, counseling, career guidance, student aid administration and health services.
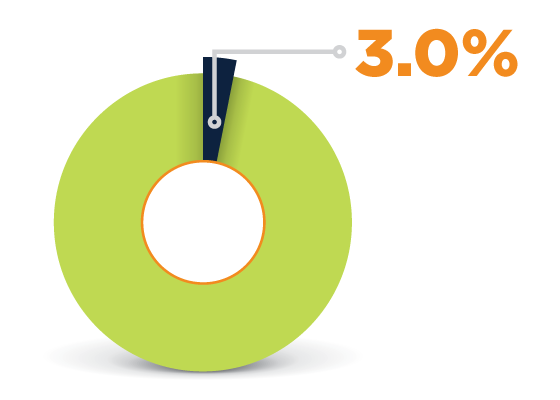
Independent Operations
$68,909,954.423.1%
Expenditures for leased employees for UT Medical Center in Knoxville and the UT Foundation.
Total: $2,284,560,468.73
The sources and uses shown are not adjusted for tuition discounts of $206,443,985.69Financials
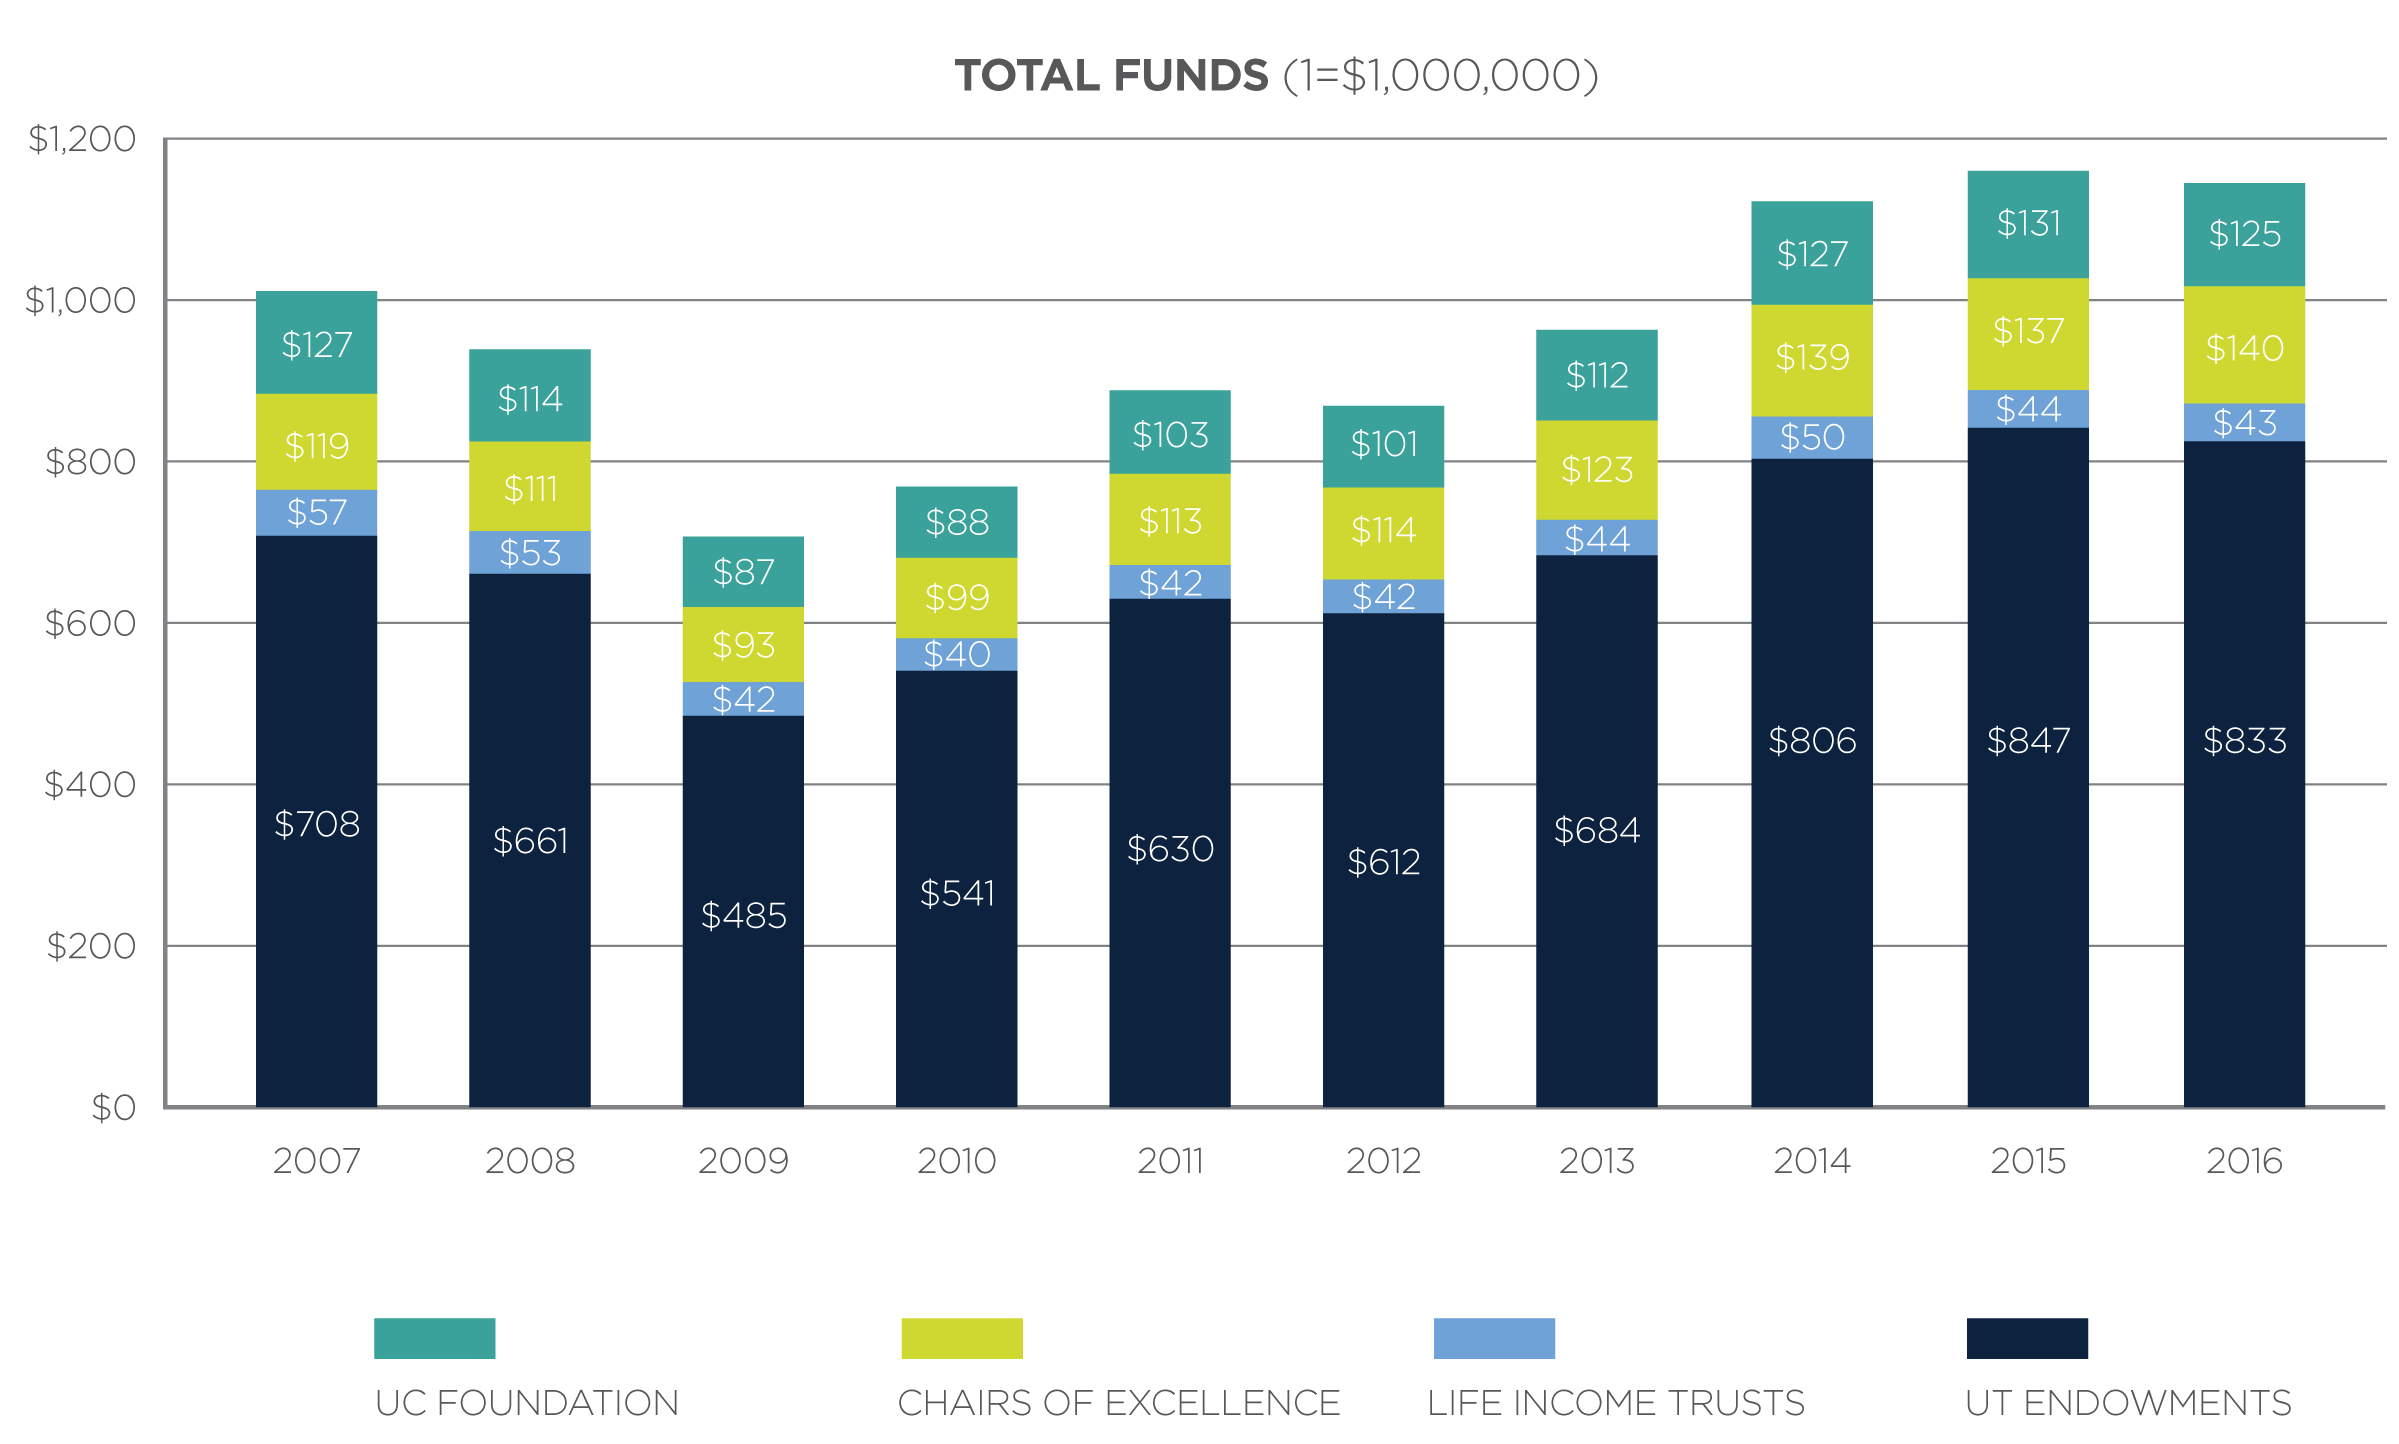
Investments Benefiting the UniversityFor the fiscal period ending June 30, 2016, total assets invested for the benefit of the University of Tennessee stood at $1.1 billion, having declined by $9 million from the prior year. This change in value was driven by a challenging environment for diversified portfolios. With negative yields on roughly 38 percent of global investment-grade debt outstanding, investors chased “high-yield” assets but shunned riskier segments of the equity markets. Not surprisingly, U.S. large and mid-cap stocks generated positive returns, along with real estate and high-quality bonds. In contrast, international developed and emerging market equities, as well as commodities, declined sharply. Until the world’s major economies stabilize and fundamentals drive the markets again, central bank policy will continue to have an outsized effect on market performance and investors’ collective behavior.
The University’s capital base includes five separate investment vehicles. At June 30, endowments accounted for $833 million, with $820 million in the Consolidated Investment Pool and $13 million in separate endowments. Chairs of Excellence were $139 million, and the University of Chattanooga Foundation was $125 million. Finally, Life Income Trusts stood at $43 million. The accompanying chart displays these categories at each fiscal year-end for the past ten years.
The Consolidated Investment Pool (the Pool) is the largest component of invested funds and was established in 1954 to allow for the diversification and efficient investment of any endowment, regardless of size. With the dual mandate of generating long-term total returns above the spending rate while simultaneously managing downside risk, it maintains a globally diversified portfolio. For the fiscal period ending June 30, the one-year total estimated return was -2.4 percent and for the last 10 years +4.1 percent. The Pool distributed $36 million in fiscal 2016, an increase of approximately $3 million from the last fiscal year. The funds distributed in any given year equal four-and-a-half percent of the five-year rolling average of the Pool’s market value at calendar year-end (December 31).
Finally, funds distributed by The Tennessee Chairs of Excellence and the University of Chattanooga Foundation were $4 million and $7 million, respectively, for the fiscal twelve-months. Both of these categories are managed outside the Pool. The Chairs of Excellence are administered by the treasurer of the state of Tennessee for the benefit of all UT campuses. The University of Chattanooga Foundation is managed by its foundation board and supports programs at UT Chattanooga only.