Financials

Sources of current funds for the fiscal year ended June 30, 2015

FEDERAL AND LOCAL APPROPRIATIONS | $25,012,364.66 (1.2%)
Appropriations received in support of the University’s land-grant missions, used primarily by the Agricultural Experiment Station and Tennessee Extension.
INDEPENDENT OPERATIONS | $70,975,325.48 (3.3%)
Revenues collected from UT Medical Center in Knoxville and the UT Foundation for leased employees.
OTHER | $113,669,627.44 (5.3%)
Revenues generated from sources not included in other classifications, such as sales and services by University departments and investment income.
AUXILIARY ENTERPRISES | $229,998,449.86 (10.7%)
Revenues from operations of auxiliary activities such as housing, dining halls, bookstores, parking and UT Knoxville athletics.
STATE APPROPRIATIONS | $500,003,117.63 (23.4%)
Legislative appropriations from the Tennessee General Assembly for current operations of the University.
GIFTS, GRANTS, AND CONTRACTS | $585,711,530.03 (27.3%)
Revenues from federal and non-federal granting entities and gifts restricted for specific purposes, primarily for sponsored research and training activities.
TUITION AND FEES | $615,545,783.68 (28.8% )
Revenues collected from students; includes resident enrollment fees, program and service fees, extension enrollment fees and other fees.
pie or donut chart representing the sources of funds, with tuition and fees, gifts, grants and contracts and state appropriations making up the largest portions of the funding

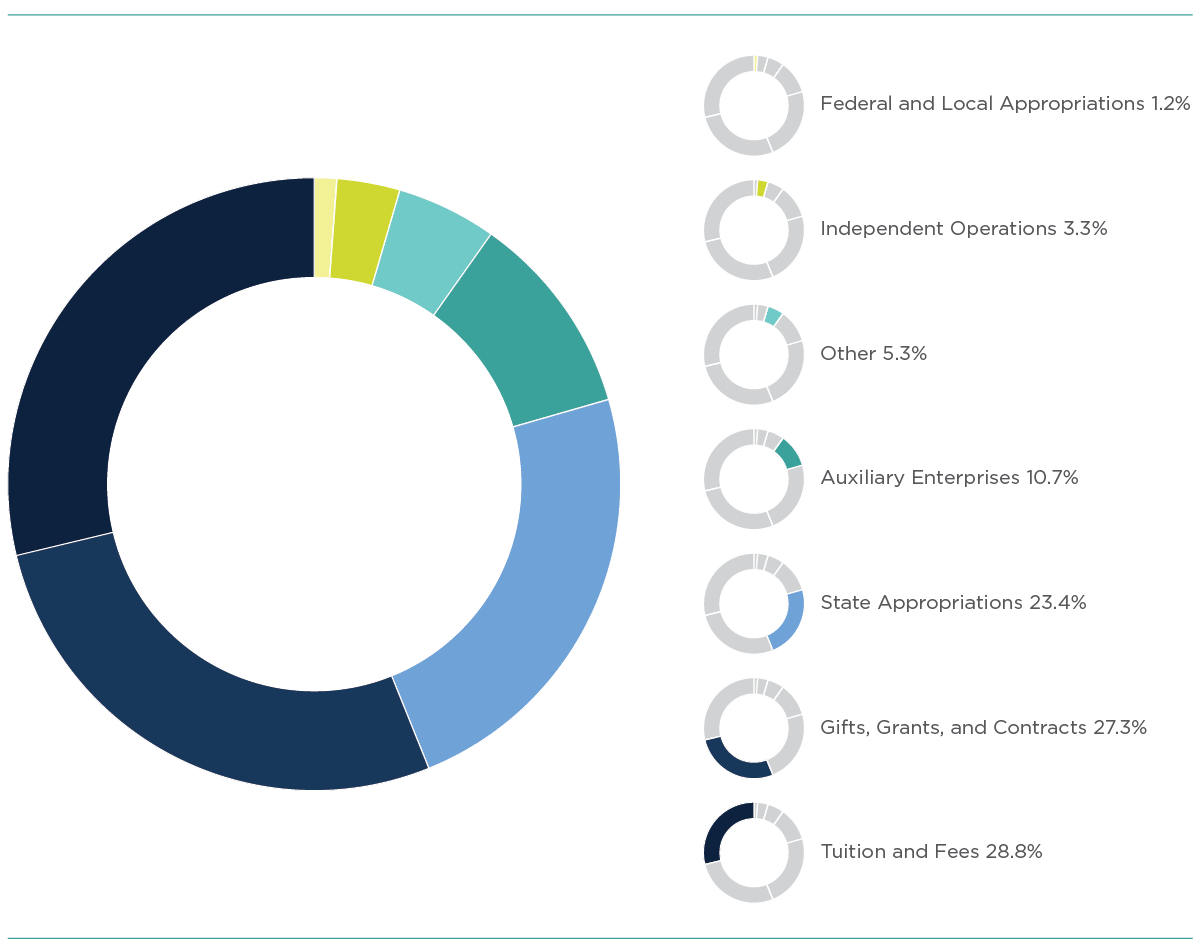
Total: $2,140,916,198.78


Uses of current funds for the fiscal year ended June 30, 2015

LONG-TERM DEBT & OTHER TRANSFERS | $70,781,739.43 (3.3%)
Mandatory transfers for debt service and other transfers.
INDEPENDENT OPERATIONS | $70,975,325.48 (3.4%)
Expenditures for leased employees for UT Medical Center in Knoxville and the UT Foundation.
STUDENT SERVICES | $89,907,820.59 (4.2%)
Expenditures for student services including admissions, registrar, student activities, counseling, career guidance, student aid administration and health services.
INSTITUTIONAL SUPPORT | $115,043,459.36 (5.4%)
Expenditures for executive management, financial operations, personnel services, security, public relations, development activities and alumni relations.
PHYSICAL PLANT | $126,208,274.95 (5.9%)
Expenditures for the operation and maintenance of physical plant including utilities and service related to grounds and facilities.
Public Service | $130,399,712.31 (6.1%)
Expenditures for non-instructional programs beneficial to individuals and groups external to the University.
Auxiliary Enterprises | $163,402,066.77 (7.7%)
Activities that furnish goods and services to students, faculty and staff. Includes mandatory transfers for debt service.
Academic Support | $180,271,748.64 (8.5%)
Expenditures for libraries, computing support and academic administration.
Research | $257,395,798.40 (12.1%)
Direct expenditures for sponsored research activities funded from federal, state, local and private sources.
Student Aid | $264,478,100.10 (12.4%)
Scholarships and Fellowships awarded to students.
Instruction | $658,486,082.60 (31.0%)
Includes all expenditures, including faculty and staff salaries incurred in connection with instruction programs for credit and non-credit courses.
bar chart of uses information, with instruction, student aid, research and academic support costs making up the majority of the budget

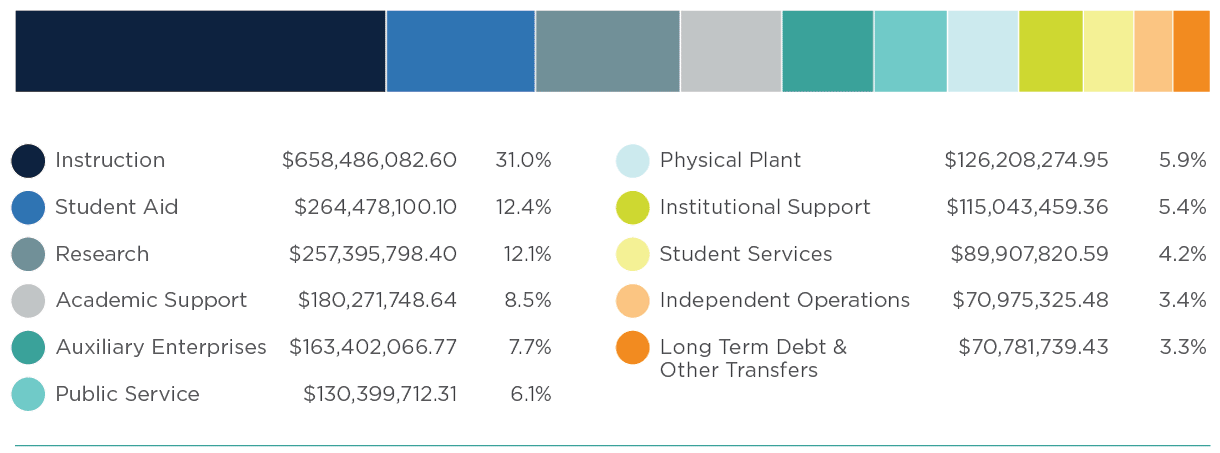
Total: $2,127,350,128.63

The sources and uses shown are not adjusted for tuition discounts of $196,448,979.22

Investments Benefiting the University

As of June 30, 2015 the amount of total assets invested for the benefit of the University of Tennessee held steady at roughly $1.1 billion, growing $38 million year over year. The solid returns of U.S. stocks on an absolute and relative basis masked a mixed global environment for investors. Generally, non-U.S. equity markets were negative for the fiscal period, as were broad segments of the global bond markets. Rising geopolitical risk, diverging economic trends, and severe declines in commodity prices, among other negative factors, came together to hamper global capital markets. Despite these challenges, most asset classes in which the University invests turned in a positive performance for the year, with only energy-related investments finishing in negative territory.

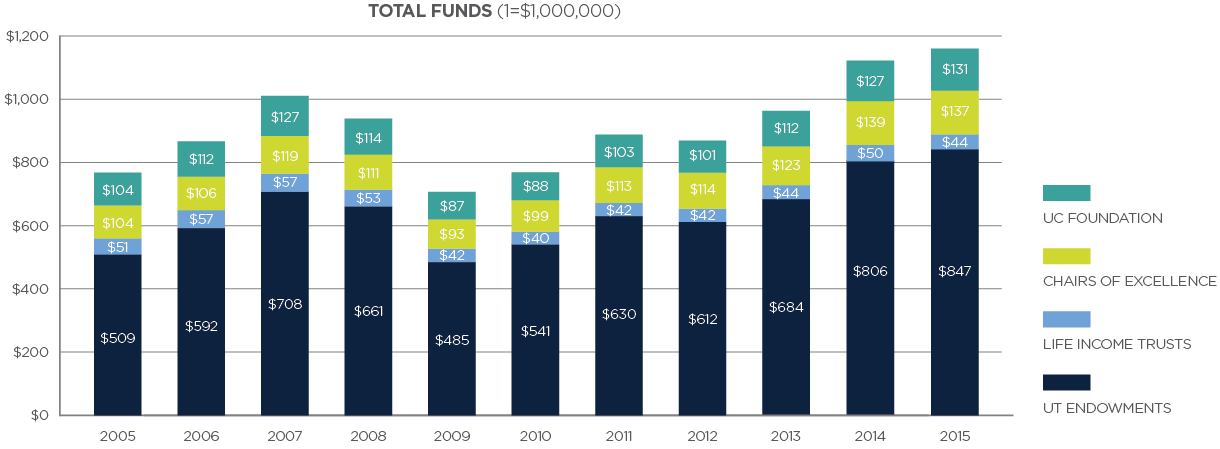
Five separate investment pools form the University capital base. Total endowments account for $847 million, which includes the Consolidated Investment Pool of $832 million and $15 million of separate endowments. Chairs of Excellence are $137 million; the University of Chattanooga Foundation, $131 million; and Life Income Trusts, $44 million. The accompanying chart displays these categories at each fiscal year-end for the past 10 years.

Chart showing the total funds from investments benefiting UT. The largest share is from UT endowments.

The Consolidated Investment Pool (the Pool) is the largest component of invested funds and was established in 1954 to allow for diversification and efficient investment of any endowment, regardless of size. As of June 30, 2015 the Pool produced a 12-month total return of approximately +1.0 percent, and +5.7 percent for the last 10 years. It distributed $33 million in fiscal 2015, an increase of approximately $3 million from the previous fiscal year. The funds distributed in any given year equal 4.5 percent of the four-year rolling average of the Pool’s market value at calendar year-end (December 31). The long-term goal of the pooled endowment investment program is to provide a sustainable and increasing level of support for University programs, while preserving the real purchasing power of the endowments for the future in perpetuity.

Finally, funds distributed by the Tennessee Chairs of Excellence and the University of Chattanooga Foundation were $3.6 million and $7.2 million, respectively, for the fiscal 12 months. Both of these categories are managed outside the Pool. The Chairs of Excellence are administered by the treasurer of the state of Tennessee for the benefit of all UT campuses. The University of Chattanooga Foundation is managed by its foundation board and supports programs at UT Chattanooga only.