Annual Report to the General Assembly 2014
×
UT logo

Education Matters in Tennessee


Fifty-five percent by 2025. That’s Gov. Haslam’s goal for the number of Tennesseans with a degree. It’s a big jump from the current rate of 32 percent. To achieve this goal, we must all work together. Alongside Tennessee Board of Regents institutions, the University of Tennessee is boosting degrees in our state by attracting, retaining and graduating our students.

More help is needed, however, to maintain momentum of the Complete College Tennessee Act, which rewards institutions for better performance. Education has to be a higher priority in the state. Through improved education at all levels, Tennessee can have a more competitive workforce and stronger future.

At the University of Tennessee, we’re taking a hard look at our business model and at how much students pay in tuition. We’re looking at every possible way we can be efficient, effective and entrepreneurial, whether that means saving on the cost to replace a roof or reorganizing an academic department, as some campuses have already done.

I look forward to 2015 and our drive to make education the best it can be in this state. All Tennesseans, current and future, deserve that opportunity.

All the best,
Joe DiPietro's signature
UT President Joe DiPietro

Joe DiPietro with a big megaphone

Does education matter to you? Speak up. Join our call for education to be a higher priority in Tennessee.

NUMBERS YOU SHOULD KNOW


$155 million

Estimated system-wide budget gap in 2025.1
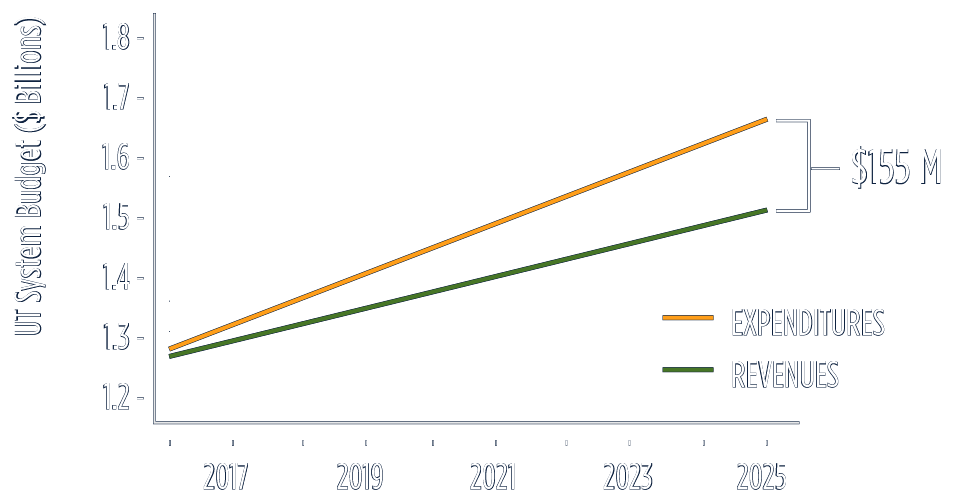
Graph depicting a gradual 155 million dollar gap between 2016 and 2025 1Based on a 10-year projection of tuition increases of 3 percent, inflation of 3 percent and no increases in state appropriations.

$4.6 billion

Estimated economic impact of UT on the Tennessee economy in FY 2013.
UT also created or impacted about 75,000 jobs.

graph depicting a small percentage of out-of pocket money for new UT freshmen

$2,349

Average net cost of tuition and mandatory fees for new freshmen at UT Knoxville, UT Chattanooga and UT Martin after subtracting the average amount for scholarships and grants.2

2Based on a $7,920 average scholarship/grant award for UT system (UT Knoxville, UT Martin, UT Chattanooga) for the 79% of undergraduates that receive grants/scholarships.

TOTAL UNRESTRICTED EDUCATIONAL AND GENERAL REVENUES
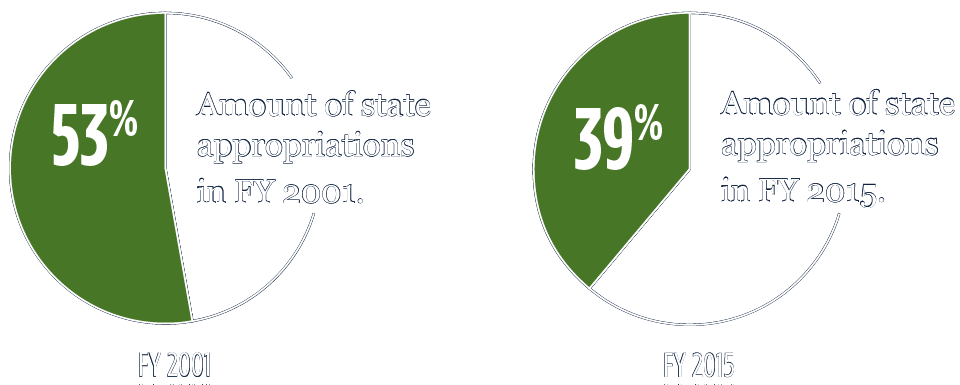
Amount of state appropriations in FY 2001: 53%. Amount of state appropriations in FY 2015: 39%.

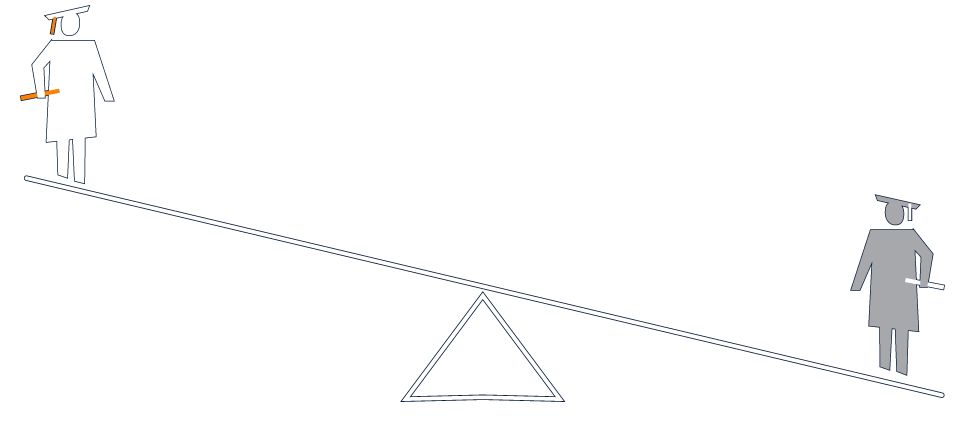
51 percent of students graduate a UT campus with debt. The average UT debt at graduation was $22,100.
Amount of state appropriations in FY 2001: 53%. Amount of state appropriations in FY 2015: 39%.

Nationally, an average of 71 percent of college graduates carry debt, with an average debt of $29,400 nationwide.3

3Source: National Institute for College Access and Success
Educate. Discover. Connect.

“The UT System’s delivery of education, discovery, outreach and public service contributes to the economic, social and environmental well-being of all Tennesseans.”

– University of Tennessee System Mission Statement

EDUCATE

Our faculty teach students through hands-on experiences that prepare graduates for careers and strengthen Tennessee's workforce.

Our faculty teach students through hands-on experiences that prepare graduates for careers and strengthen Tennessee's workforce.

Julie Hill, associate professor of percussion at UT Martin, encourages students to form musical groups and create their own instruments. A UT Martin alumna, Hill is a recipient of the school’s most prestigious teaching honor, the Cunningham Outstanding Teacher/Scholar Award.


See and Hear More

TEACHING OUTSIDE THE CLASSROOM

Rob Heller and Photojournalism students

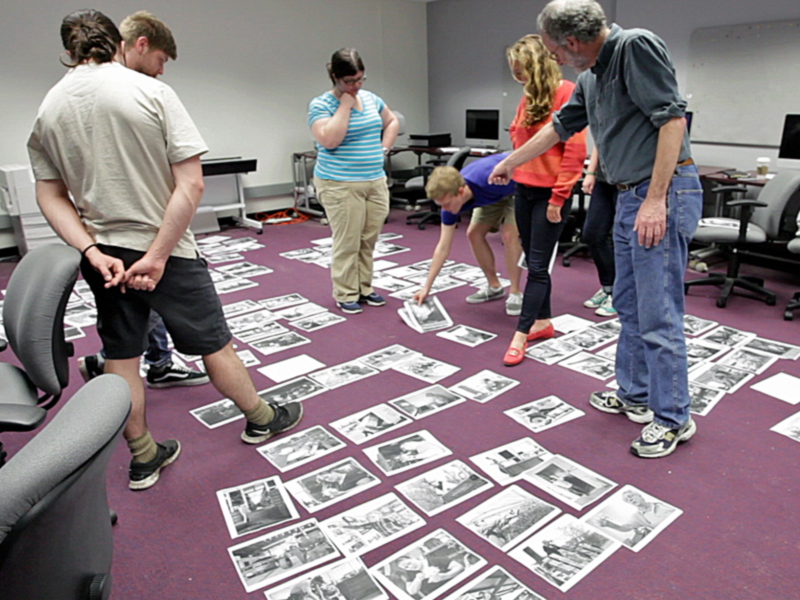
Rob Heller, professor in the School of Journalism and Electronic Media at UT Knoxville, takes his advanced photojournalism students to LaFollette, Tenn., each year for a special photography project on life in the town. An exhibit at the Tennessee State Museum honors the project’s 20th anniversary.

See the Photos »

LEARNING BY HELPING

Rosebelle Peters

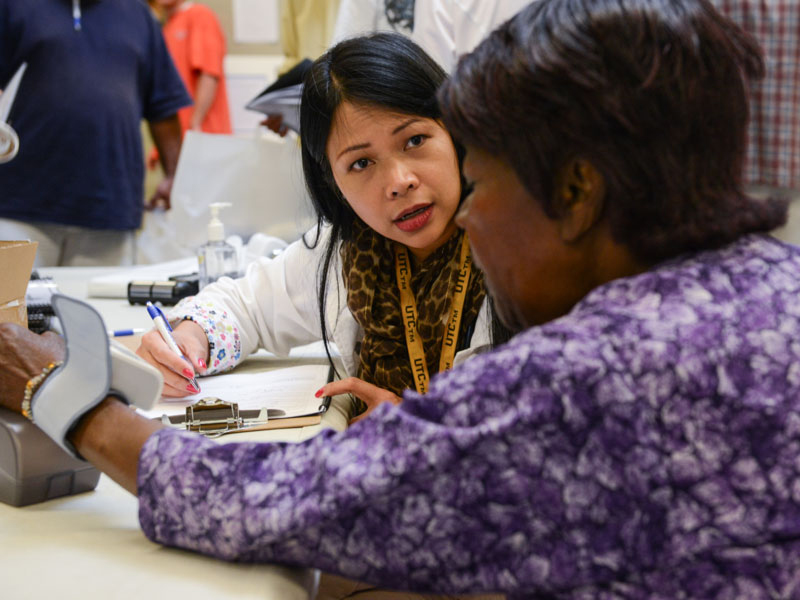
Rosebelle Peters, a lecturer in nursing at UT Chattanooga, trains students through clinical practice, such as a health fair for the homeless that provided health screenings, flu shots and foot care.

Learn More »

DISCOVER

Our Researchers Find Solutions That Improve Quality of Life for all of Tennessee and beyond.

Our Researchers Find Solutions That Improve Quality of Life for all of Tennessee and beyond.

Monica Jablonski, professor of ophthalmology at UT Health Science Center, and assistant professor Shankar Swaminathan and post-doc researcher Mallika Palamoor work with a compound to treat age-related atrophic macular degeneration that is delivered through nanoparticles injected in the eye.

Discover More UT Inventions

ADVANCING ENERGY STORAGE TECHNOLOGY

Matthew Mench and Thomas Zawodzinski with their invention

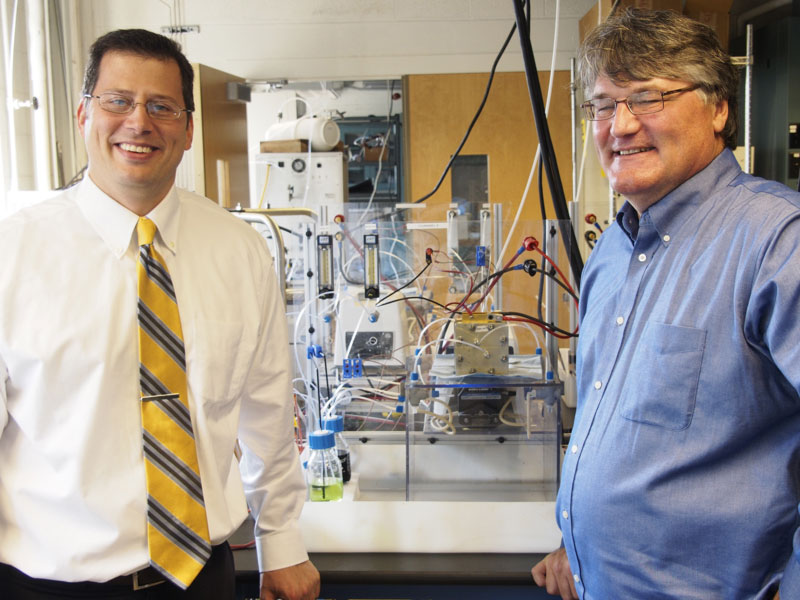
Matthew Mench, Condra Chair of Excellence in mechanical engineering, at UT Knoxville and Thomas Zawodzinski, UT-Oak Ridge National Laboratory Governor’s Chair in electrical energy storage, are developing techniques to improve the performance and efficiency of vanadium flow batteries used to store wind or solar power.

BOOSTING AGRICULTURAL INDUSTRIES

Neal Schrick and Lannett Edwards

Neal Schrick and Lannett Edwards, professors of animal science in the Institute of Agriculture, help the beef and dairy industries by promoting fertility in cows through their patented Embryo Guard technique, which protects embryos and helps cows carry to term.

CONNECT

Our Faculty, Staff and Students Make a Difference in all of Tennessee's 95 Counties Through Outreach

Our Faculty, Staff and Students Make a Difference in all of Tennessee's 95 Counties Through Outreach

Doug Bodary, County Technical Assistance Service consultant, and colleagues in the Center for Industrial Services help officials in Rutherford and other counties save money with more energy-efficient buildings.

Read More

Funding Seeds of Change

UT Extension agent Tim Campbell consults with a farmer

Tim Campbell, UT Extension agent in Dyer County, works with the Commodities for Communities program, which allows farmers to donate some of their harvests to fund agricultural research, outreach and education.

Watch the Video »

Closing Gaps in Health Literacy and Access

Paul Juarez and Patricia Matthews-Juarez on Beale Street in Memphis

Paul Juarez and Patricia Matthews-Juarez, co-directors of the Research Center on Health Disparities, Equity and the Exposome at UT Health Science Center, focus on improving the health status among the poor and underserved in Memphis and across the state.

Read More About the Project »

Financials / Sources of Current Funds for the Fiscal Year Ended June 30, 2014


FEDERAL AND LOCAL APPROPRIATIONS  $20,398,952.38

Appropriations received in support of the University's land-grant missions, used primarily by the Agricultural Experiment Station and Tennessee Extension.

INDEPENDENT OPERATIONS  $74,470,437.96

Revenues collected from UT Medical Center in Knoxville and the UT Foundation for leased employees.

OTHER   $116,147,045.06

Revenues generated from sources not included in other classifications, such as sales and services by University departments and investment income.

AUXILIARY ENTERPRISES   $206,143,803.44

Revenues from operations of auxiliary activities such as housing, dining halls, bookstores, parking and UT Knoxville athletics.

STATE APPROPRIATIONS   $487,077,081.07

Legislative appropriations from the Tennessee General Assembly for current operations of the University.

TUITION AND FEES   $573,319,527.91

Revenues collected from students; includes resident enrollment fees, program and service fees, extension enrollment fees and other fees.

GIFTS, GRANTS, AND CONTRACTS   $580,112,787.50

Revenues from federal and non-federal granting entities and gifts restricted for specific purposes, primarily for sponsored research and training activities.

Financials / Uses of Current Funds for the Fiscal Year Ended June 30, 2014


LONG TERM DEBT & OTHER TRANSFERS   $64,169,183.99

Mandatory transfers for debt service and other transfers.

INDEPENDENT OPERATIONS   $74,470,437.96

Expenditures for leased employees for UT Medical Center in Knoxville and the UT Foundation.

STUDENT SERVICES   $85,814,221.61

Expenditures for student services including admissions, registrar, student activities, counseling, career guidance, student aid administration and health services.

INSTITUTIONAL SUPPORT   $116,334,212.78

Expenditures for executive management, financial operations, personnel services, security, public relations, development activities and alumni relations.

PHYSICAL PLANT   $123,892,535.04

Expenditures for the operation and maintenance of physical plant including utilities and service related to grounds and facilities.

PUBLIC SERVICE   $129,650,660.03

Expenditures for non-instructional programs beneficial to individuals and groups external to the University.

AUXILIARY ENTERPRISES   $159,167,545.77

Activities that furnish goods and services to students, faculty and staff. Includes mandatory transfers for debt service.

ACADEMIC SUPPORT   $170,229,817.44

Expenditures for libraries, computing support and academic administration.

STUDENT AID   $258,091,785.40

Scholarships and Fellowships awarded to students.

RESEARCH   $264,215,844.12

Direct expenditures for sponsored research activities funded from federal, state, local and private sources.

INSTRUCTION   $664,584,016.47

Includes all expenditures, including faculty and staff salaries incurred in connection with instruction programs for credit and non-credit courses.

Financials / Investments Benefiting the University


At the end of fiscal year 2014, the amount of total funds invested for the benefit of UT stood at roughly $1.1 billion, an increase of $157 million over the previous fiscal year. Every asset class in which the University was invested generated positive returns, as the capital markets continued to benefit from the trends in place over the last few years: abundant liquidity, mild inflation, low default rates, and strong corporate earnings.

Five separate components comprise this capital base. Total endowments account for $806 million, which includes the Consolidated Investment Pool of $791 million, as well as $15 million of separate endowments. Chairs of Excellence are $139 million; the University of Chattanooga Foundation, $103 million; and Life Income Trusts, $50 million. The following chart shows these fund categories at each fiscal year-end for the past ten years:

The Consolidated Investment Pool (the Pool) is the largest component of invested funds and was established in 1954 to allow for the diversification and efficient investment of any endowment, regardless of size. As of June 30, 2014, the Pool produced a 12-month total return of approximately 17.4 percent, and 6.8 percent for the last 10 years. It distributed $30.7 million in fiscal 2014, an increase of more than $2 million from the previous year.

The funds distributed in any given year equal 4.5 percent of the three-year rolling average of the Pool’s market value at calendar year end (Dec. 31). The long-term goal of the pooled endowment investment program is to provide a sustainable and increasing level of support for University programs, while preserving the real purchasing power of the endowments for the future in perpetuity.

Finally, funds distributed by the Tennessee Chairs of Excellence and the University of Chattanooga Foundation were $3.5 million and $6.4 million, respectively, for the fiscal year. Both of these categories are managed outside the Pool. The Chairs of Excellence are administered by the treasurer of the state of Tennessee for the benefit of all UT campuses. The University of Chattanooga Foundation is managed by its foundation board and supports programs at UT Chattanooga only.

Fall Enrollment 2013-14 (Headcount)


UT SYSTEM 2010 2011 2012 2013 2014 5-year Change
Undergraduate 38,573 38,605 38,401 38,504 38,656 0.2%
Graduate 10,992 10,940 10,843 10,623 10,442 -5.0%
Total 49,565 49,545 49,244 49,127 49,098 -0.9%
UT KNOXVILLE 2010 2011 2012 2013 2014 5-year Change
Undergraduate 21,308 21,126 20,829 21,033 21,451 0.7%
Graduate Academic 5,395 5,399 5,407 5,349 5,219 -3.3%
Graduate Professional 820 854 782 789 740 -9.8%
Total 27,523 27,379 27,018 27,171 27,410 -0.4%
UT CHATTANOOGA 2010 2011 2012 2013 2014 5-year Change
Undergraduate 9,229 9,891 10,159 10,297 10,315 11.8%
Graduate 1,552 1,547 1,501 1,377 1,355 -12.7%
Total 10,781 11,438 11,660 11,674 11,670 8.2%
UT MARTIN 2010 2011 2012 2013 2014 5-year Change
Undergraduate 7,947 7,500 7,326 7,025 6,677 -16.0%
Graduate 522 413 425 398 365 -30.1%
Total 8,469 7,913 7,751 7,423 7,042 -16.8%
UT HEALTH SCIENCE CENTER 2010 2011 2012 2013 2014 5-year Change
Undergraduate 89 88 87 149 213 139.3%
Graduate Academic 1,062 1,115 1,111 1,067 1,063 0.1%
Graduate Professional 1,641 1,612 1,617 1,643 1,700 3.6%
Total 2,792 2,815 2,815 2,859 2,976 6.6%